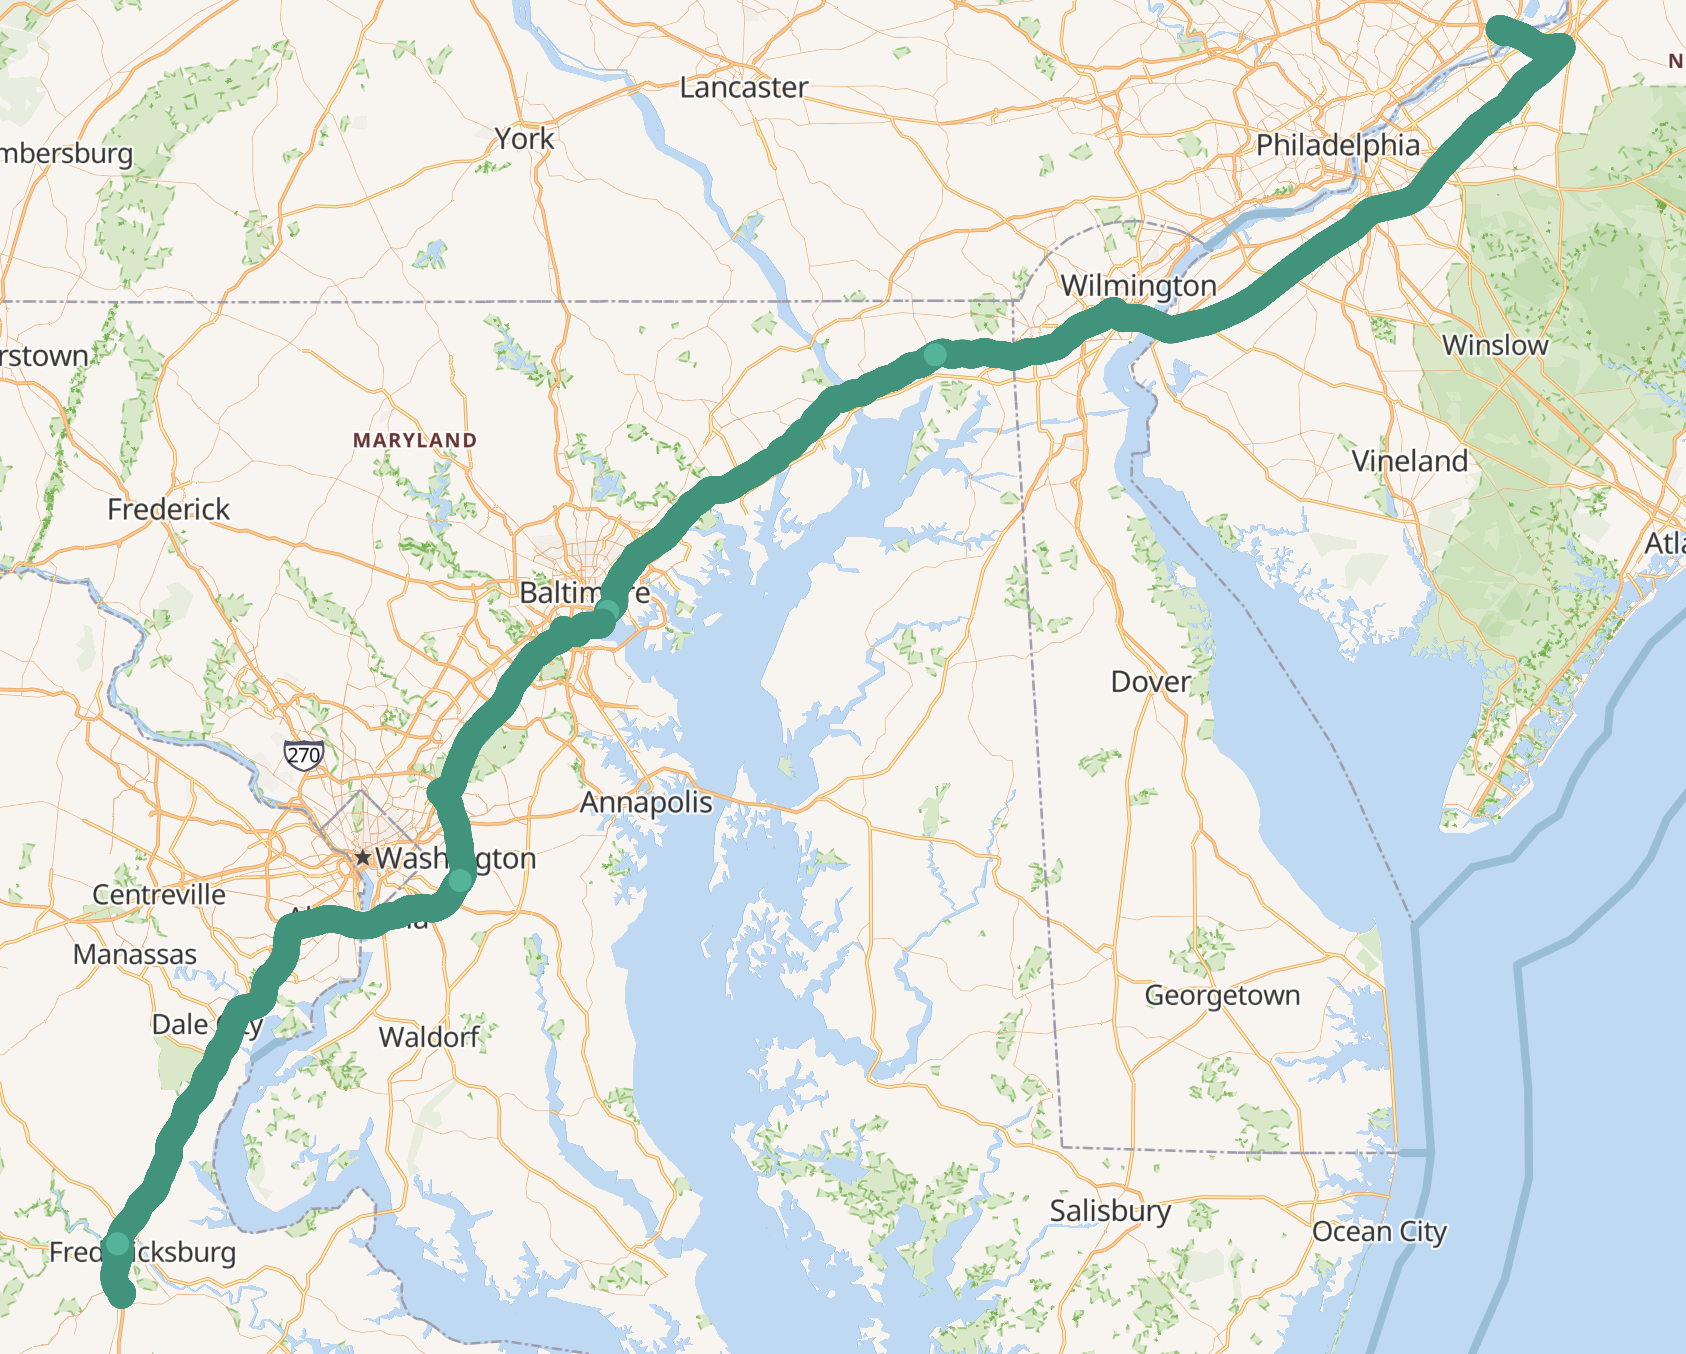
Comparison of AT&T and Verizon 1/6/22 from Levittown, PA to Fredericksburg, VA (RAN Performance)
Time: 1/6/22 1600 - 1/6/22 2000
Full Route:
RAN Performance
Verizon
RSRQ <= -16 AND RSRP <= -118 (25 Plots)
RSRQ >= -5 AND RSRP >= -81 (482 Plots)
RSRQ <= -20 (53 Plots)
RSRQ >= -5 (1768 Plots)
RSRP <= -130 (0 Plots)
RSRP >= -81 (1804 Plots)
Percentage of Time on 5G (NSA): 32.7%
Bandwidth >= 20 Mhz: 60.2% of Time
Median RSRQ: -10
Median RSRP: -95
Unique Towers/Nodes: 175
Unique Cells: 323
AT&T
RSRQ <= -16 AND RSRP <= -118 (83 Plots)
RSRQ >= -5 AND RSRP >= -81 (385 Plots)
RSRQ <= -20 (37 Plots)
RSRQ >= -5 (966 Plots)
RSRP <= -130 (18 Plots)
RSRP >= -81 (961 Plots)
Percentage of Time on 5G (NSA): 14.6 %
Bandwidth >= 20 Mhz: 5.6% of Time
Median RSRQ: -10
Median RSRP: -99.145
Unique Towers/Nodes: 176
Unique Cells: 397
From these results, it appears that Verizon has the best coverage ( 0 plots below -130 rsrp). RSRQ numbers are fairly similar but Verizon may have slight edge (more plots better than -5 RSRQ). Verizon had more plots better than 95th percentile and less plots for 5th percentile which combines rsrq/rsrp ratings. The median RSRP on Verizon was slightly better (-95 versus -99.145) which lines up with the plot measurements of RSRP. Verizon had a little more bandwidth (20 Mhz) for a longer time as compared to AT&T.
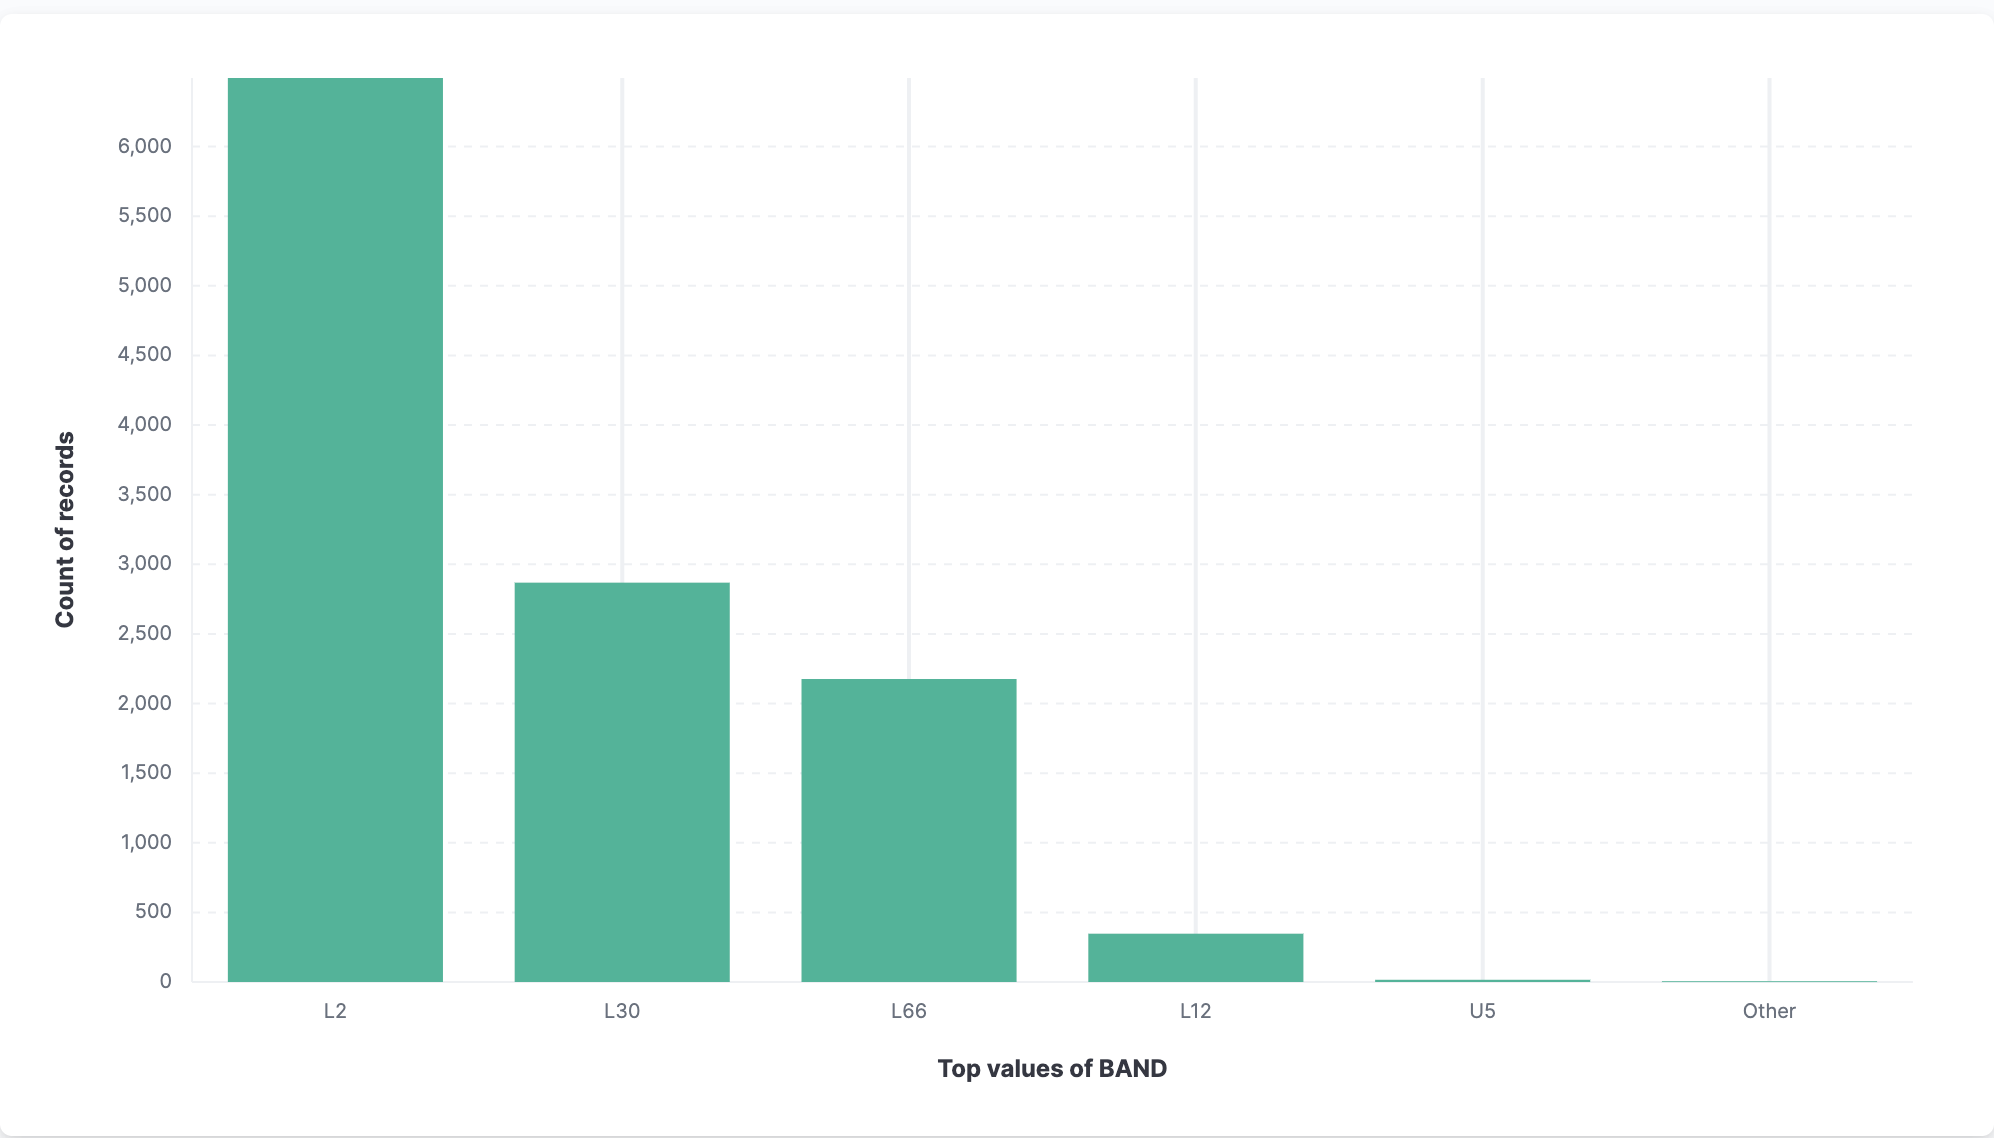
Bands Seen:
Verizon:
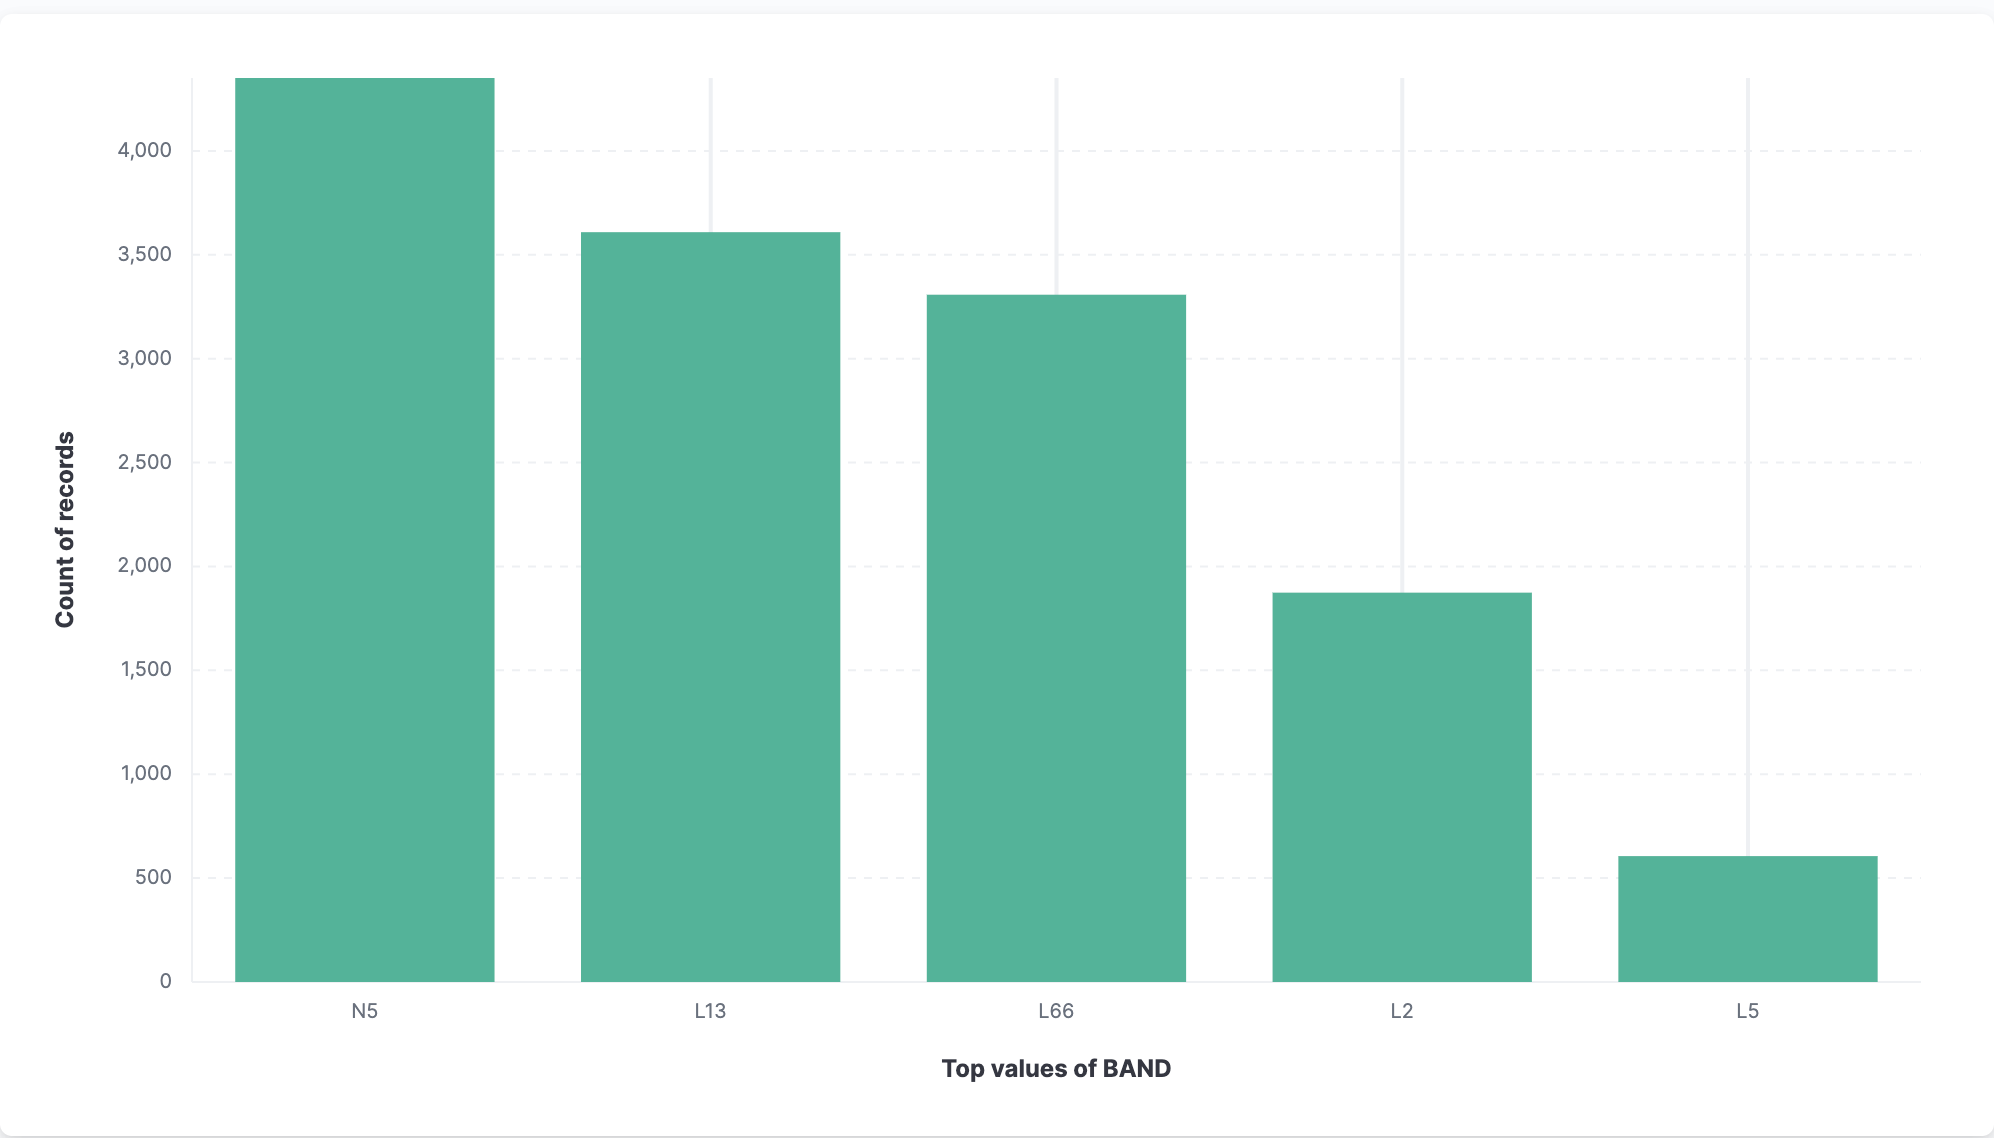
AT&T: