Drive Testing Methods (Part 1)
It's been a while since I've posted some new content. So here is some stuff I've been working on lately.
As you may recall, I use Gyokov NetTrack-Pro a lot. The ability to automatically log data via to my server is very important. I plot all of this on an Elasticsearch instance to map KPI (Key performance indicators). There are also a variety of tests that I use including the Ping and download tests.
Over the last month or so, I've acquired a Google Pixel 6A phone and have top-tier plans with Verizon, AT&T, and T-Mobile running on it. The phone is rooted and I am now using Network Signal Guru (Android app) and Airscreen to do more analysis on the computer. Network Signal Guru and Airscreen let me do a deeper analysis when I spot issues that appear in my Elasticsearch instance (based on NetTrack-Pro). Many thanks to Pei at QTRun for providing more with a license for Airscreen and Network Signal Guru.
These two tools are used together when doing my drive tests. For the most part, my drive testing is based on travels I do through out my area whether it is running errands or taking a family trip. I don't typically make special trips to do this work (since this is currently only a hobby).
I'm still very much a novice at this but am learning more everyday. This article (first-part of series) will show how I use the tools in my toolbox to do my standard drive tests (random travels through my area). Articles two and three (to come later), will show how to other types of drive-tests including walking, single-tower analysis, throughput analysis, and information on the signaling (that I get from Network Signal Guru).
A Sample Drive
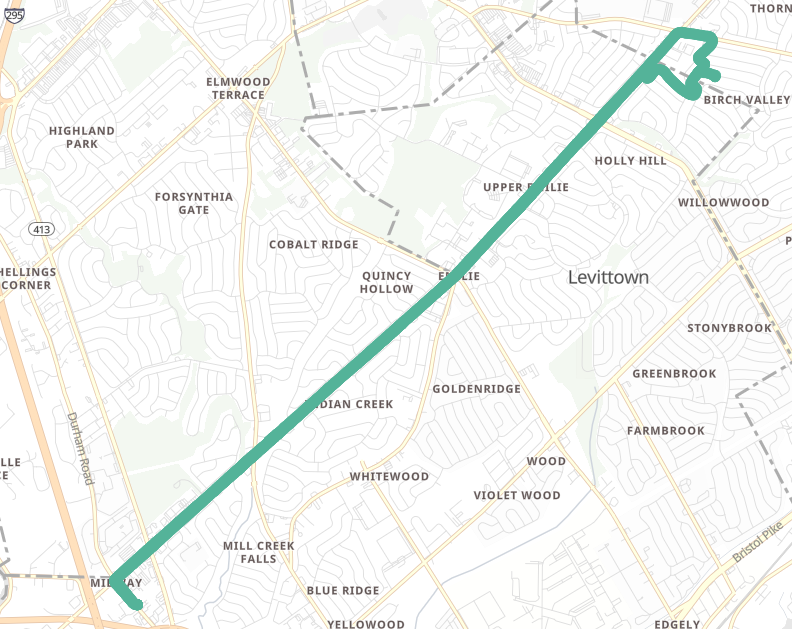
Here is a sample drive I took in my area (to run some errands). This was logged on my Pixel 6A on Verizon's network. This is only a short-drive (maybe about 5 miles or so each way).
As I mentioned previously, there are may KPIs (Key Performance Indicators) that I acquire during my trips to include RSRP, RSRQ, SINR, Band info, Bandwidth, Carrier Aggregation (active or not), and ping/download times to name a few.
I basically use NetTrack-Pro to get a concise list of KPIs and can run queries/analysis with this data on my Elasticsearch instance (map). When I see issues, I can dig deeper using Network Signal Guru and Airscreen.
When I have new data to analyze, I will first look at RSRP values for 4G/5G network that were acquired. Verizon has some band 77 sites in my area (this is part of their Ultra-wide band) and the NSA that is based on Dynamic Spectrum Sharing (DSS) that is their nationwide 5G network.
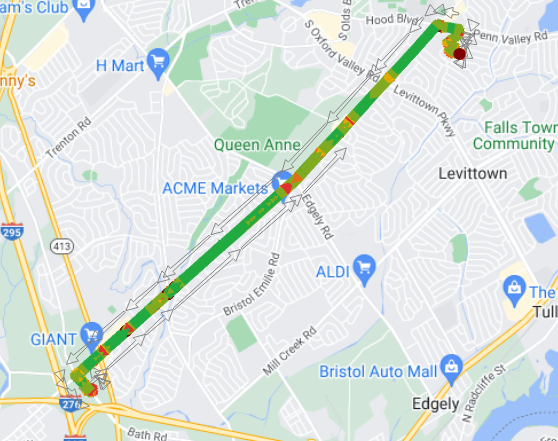
4G RSRP
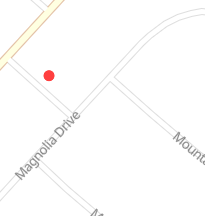
In my graph, currently red is an RSRP value <- 112 (this is automatically calculated based on averaging of data collected).
Let's look at two areas that show problematic
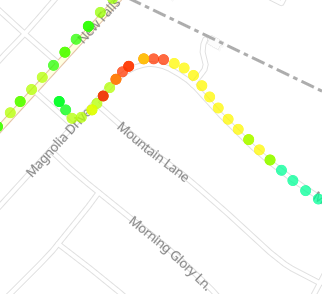
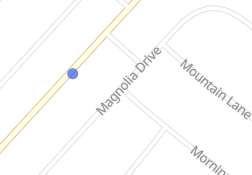
This area happens to be right beneath a shared AT&T and T-Mobile site. I'm not sure if this is a coincidence or not.
In my notepad, I will put a note saying something along the lines of RSRP value low and a timestamp (this will be used later to correlate some information). The RSRP value is -121 and timestamp is 2023.05.19_10.19.03.
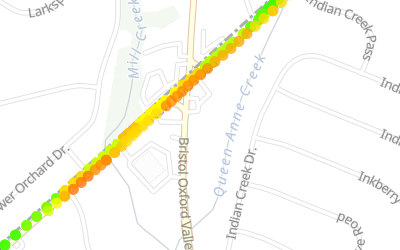
Another location that is showing problematic with RSRP (-116) and timestamp of approximately 2023.05.19_10.10.37.
Let's now change to RSRQ readings to see if there are any values of that around the same time as the low RSRP readings. The one area at the base of the AT&T and T-Mobile tower is showing up again.
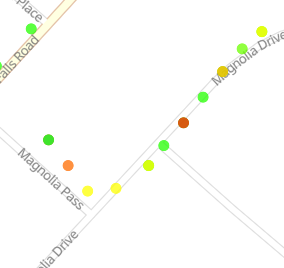
RSRQ value is -19 so kind of bad.
We will re-visit this issue later.
Download and Ping Tests
As part of my testing, I periodically run ping and download tests. There are some. I like to look at the average download and ping times as well as maximums/minimums, ping loss, and standard deviation from ping tests.
For download speeds, red and orange mean a download speed less than 40 Mbps.
The same area showed up again (right underneath the T-Mobile and AT&T tower) for timestamp 2023.05.19_10.18.52
Download speed in this instance topped-out at only 1.5 Mbps (slowwwww).
The other area I indicated earlier also shows up at Timestamp 2023.05.19_09.54.57
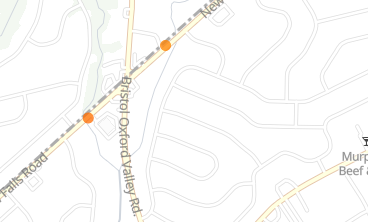
Download speeds there were only around 20Mbps. Not as bad but still slow.
The last thing I want to look at is high ping time or high ping standard deviation (a high swing from the average).
There is one high ping time (above 550 ms) in an area close to the T-Mobile/AT&T tower but not the exact-same location.
Let's now look at ping standard deviation. Same place again
This value was 212 milliseconds (high).
Lastly, let's look to see if there was any ping-loss (or packet-loss).
I won't show the results in screenshot again but there is a 10 percent ping-loss at the same two locations that I mentioned previously.
Here is what we know so far
Bad RSRP, RSRQ, ping, and download near T-Mobile/AT&T tower at around 2023.05.19_10.19.03.
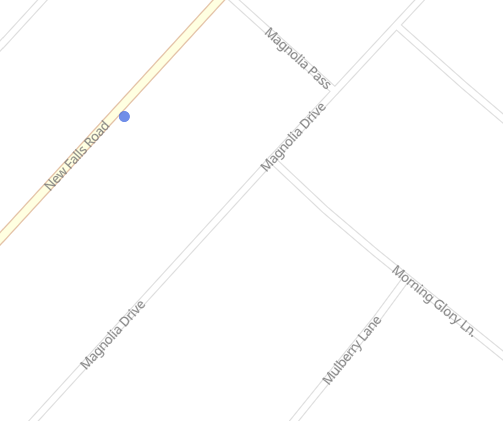
Similar bad numbers at Bristol-Oxford Valley Road and New Falls Road around 2023.05.19_09.54.57.
Based on what I know so far, I would assume these download issues are due to a RAN (Radio Access Network) issue since signal-strength/quality was bad in these cases.
If the signal qualities were good and download/ping speeds were bad, it could possibly be a backhaul problem.
A good exercise would be to get a baseline of maximum speeds you can expect in this area. This information could be obtained during an off-peak hour at a location (close to tower) that has good signal readings (RSRP/RSRQ/CQI/MCS/etc).
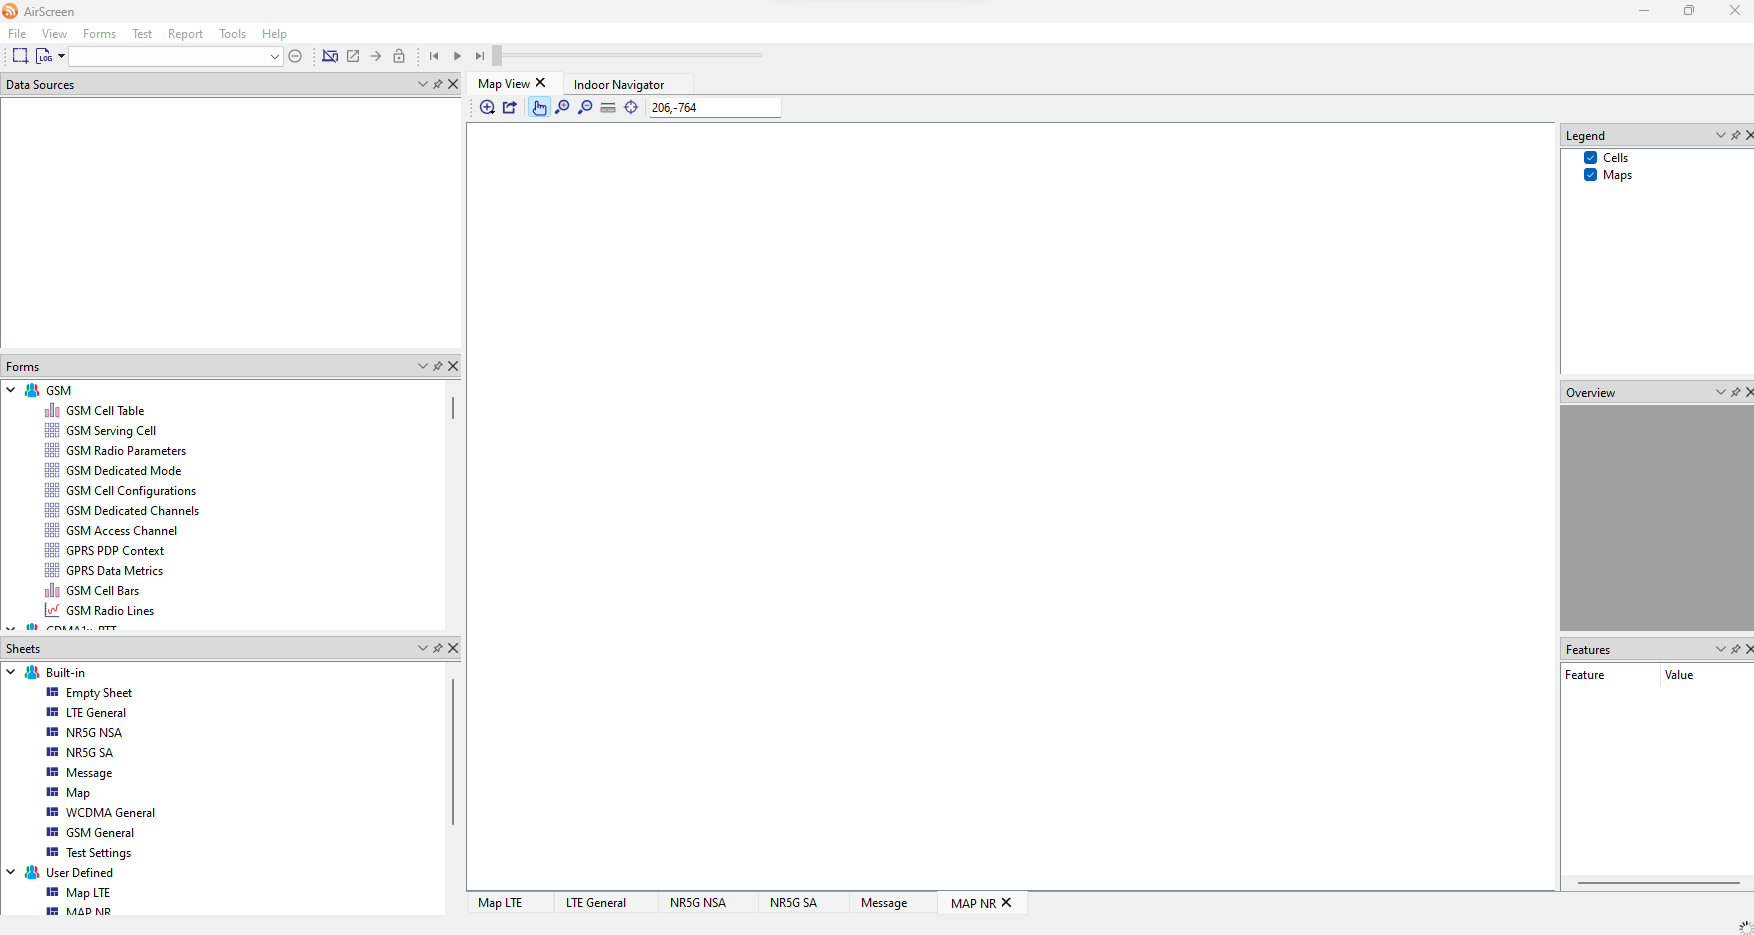
Analysis Using AirScreen
In Airscreen, I have a few different sheets loaded to show mapping data, LTE/5G metrics, and signaling data. Some of this data can only be obtained using Network Signal Guru. Having two sources of information allows me to cross-check based on some of the information I obtained on my ElasticSearch instance using NetTrack-Pro.
After loading the data, I can now see more information
Here is my tracking information (to ensure all points were captured). The color-codes on this screen have no relevance.
We see some of the same areas that showed on Elasticsearch for bad RSRP. Sometimes the signal collection on Network Signal Guru is more precise as well (higher sampling rate) and picks up on some things that NetTrack-Pro did not.
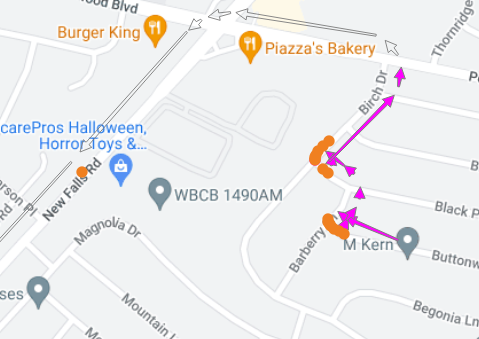
For each of these screenshots below, the orange and red mean poor values of RSRP/RSRQ.
The issues are mostly in the same places.
Let's now look at the times that downloads occured in each of these locations to see what the issue may be. It appears to be a weak signal but let's check some things to be sure there are no other ill effects as a result of this.
Since Verizon uses LTE/5GNSA, I will scroll close to the two timestamps I collected previously and look for data transfer throughput.
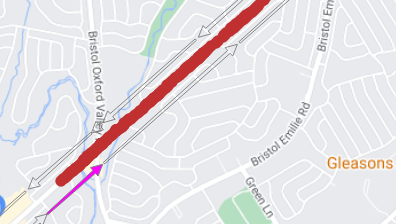
2023.05.19_10.19.03
This is the issue at New Falls Road and Bristol-Oxford Valley Road.
Let's look at some of the information I am seeing approximately around this time. It appears that the phone was switching and forth between LTE and 5G NSA.
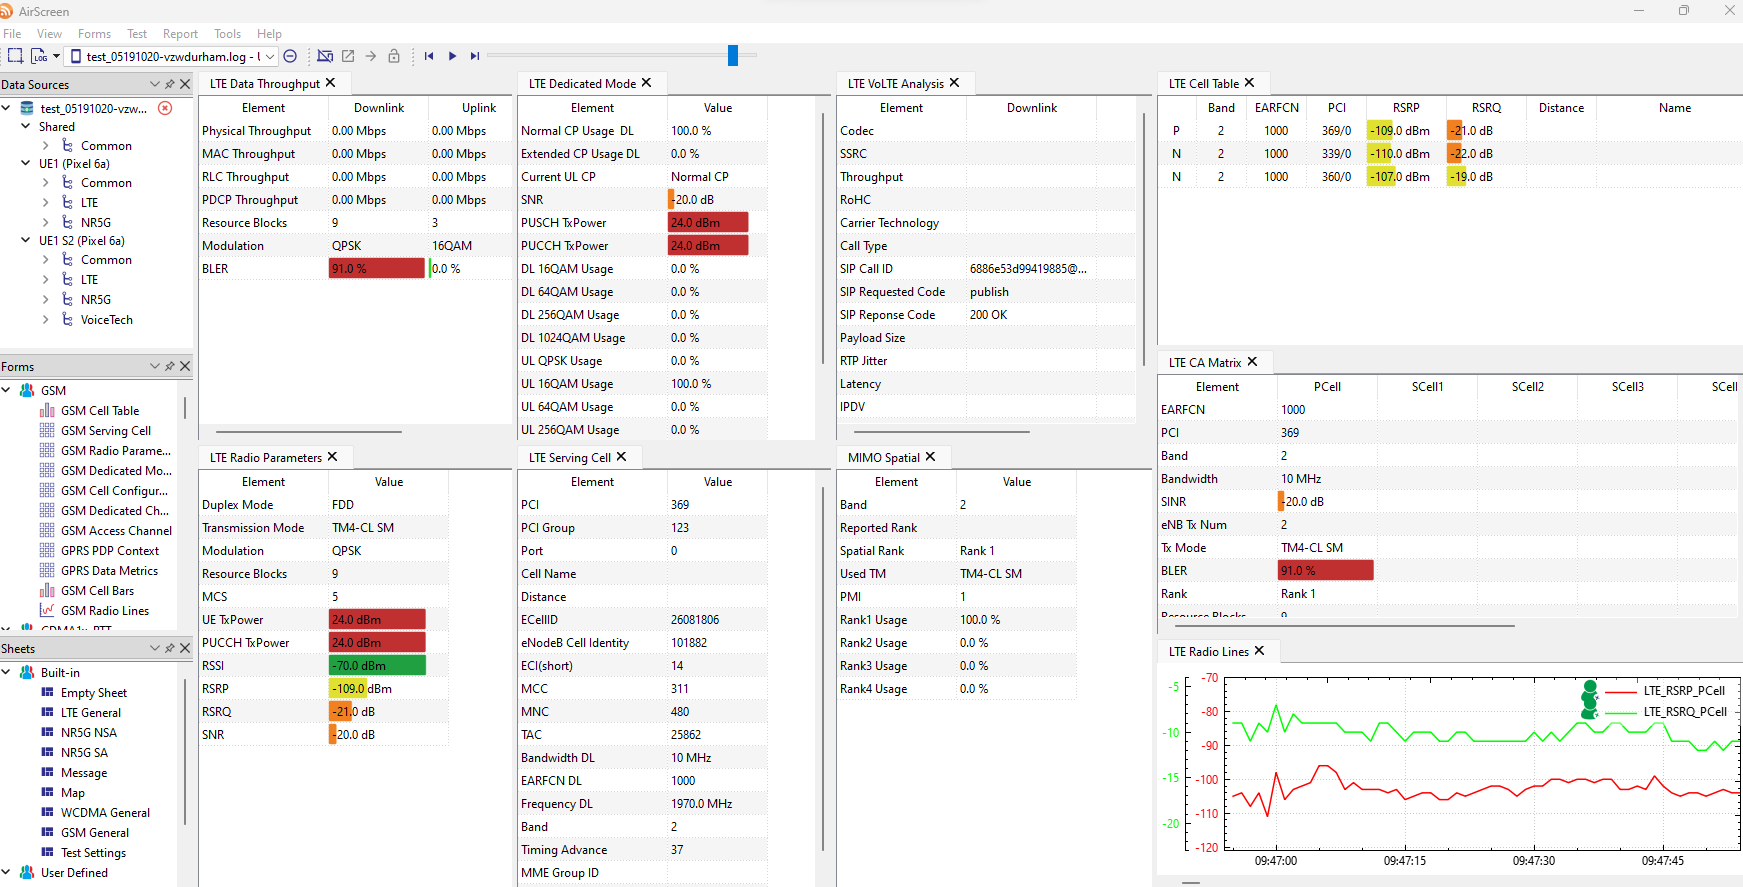
Notice the high BLER values (91%) and very bad values of RSRQ for primary LTE cell (-21 DB).
Let's look at 5G NSA sheet
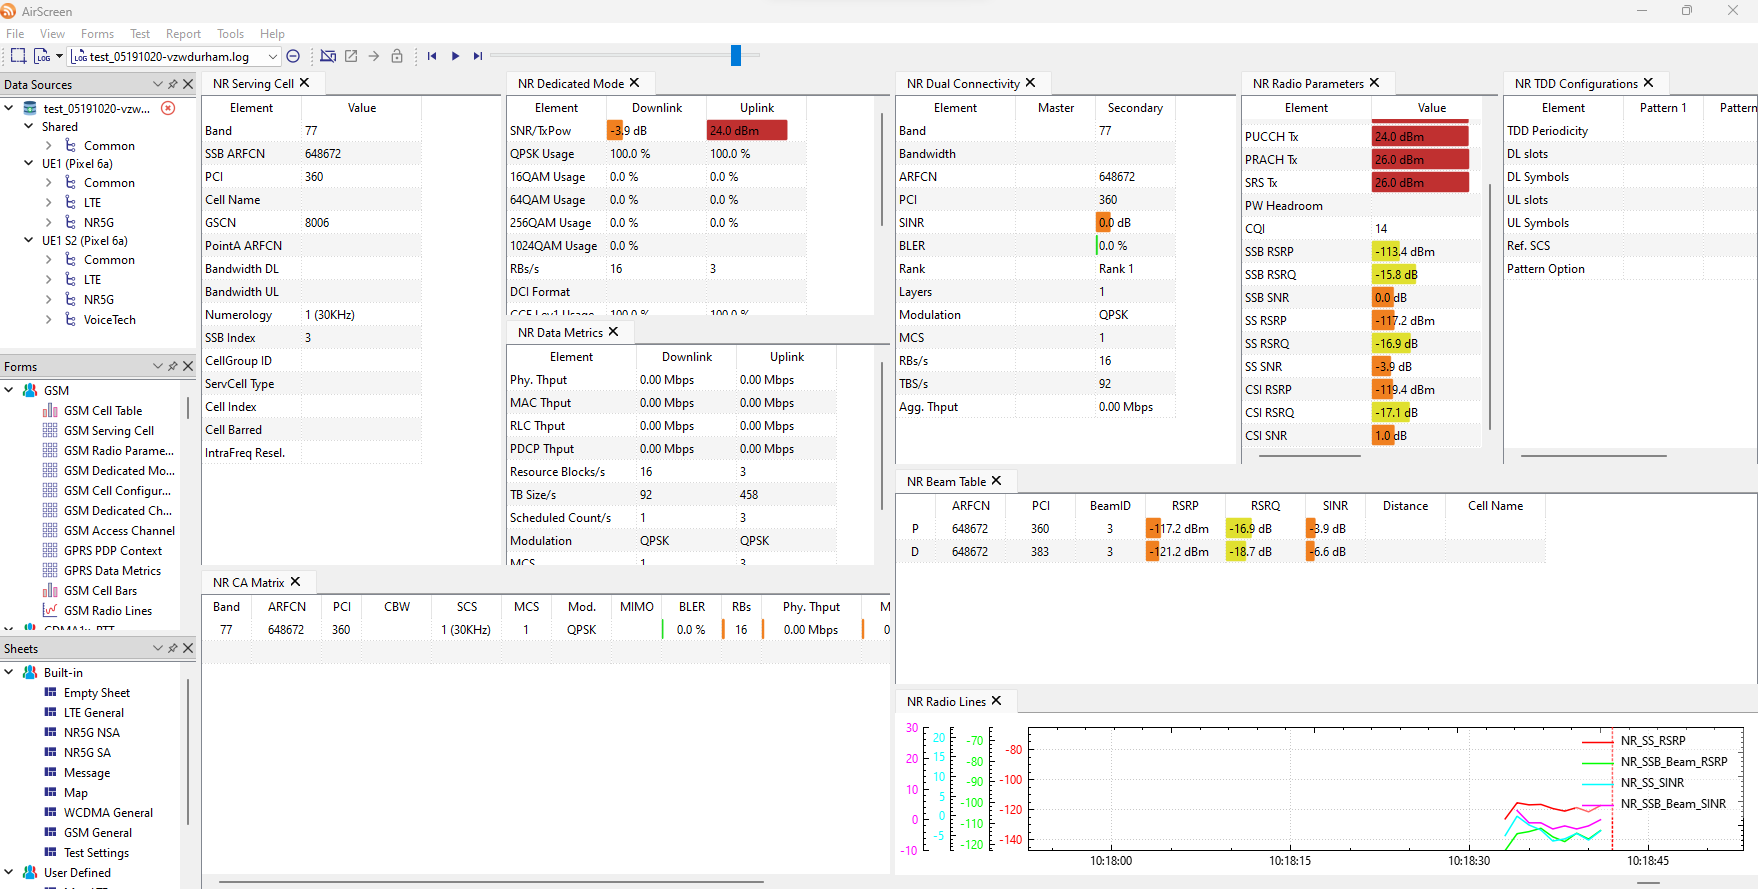
NSA (C Band 77) is in the picture but signal is way too weak. Notice in the beam table that RSRP and RSRQ are bad.
Let's also look at data throughput around this time.
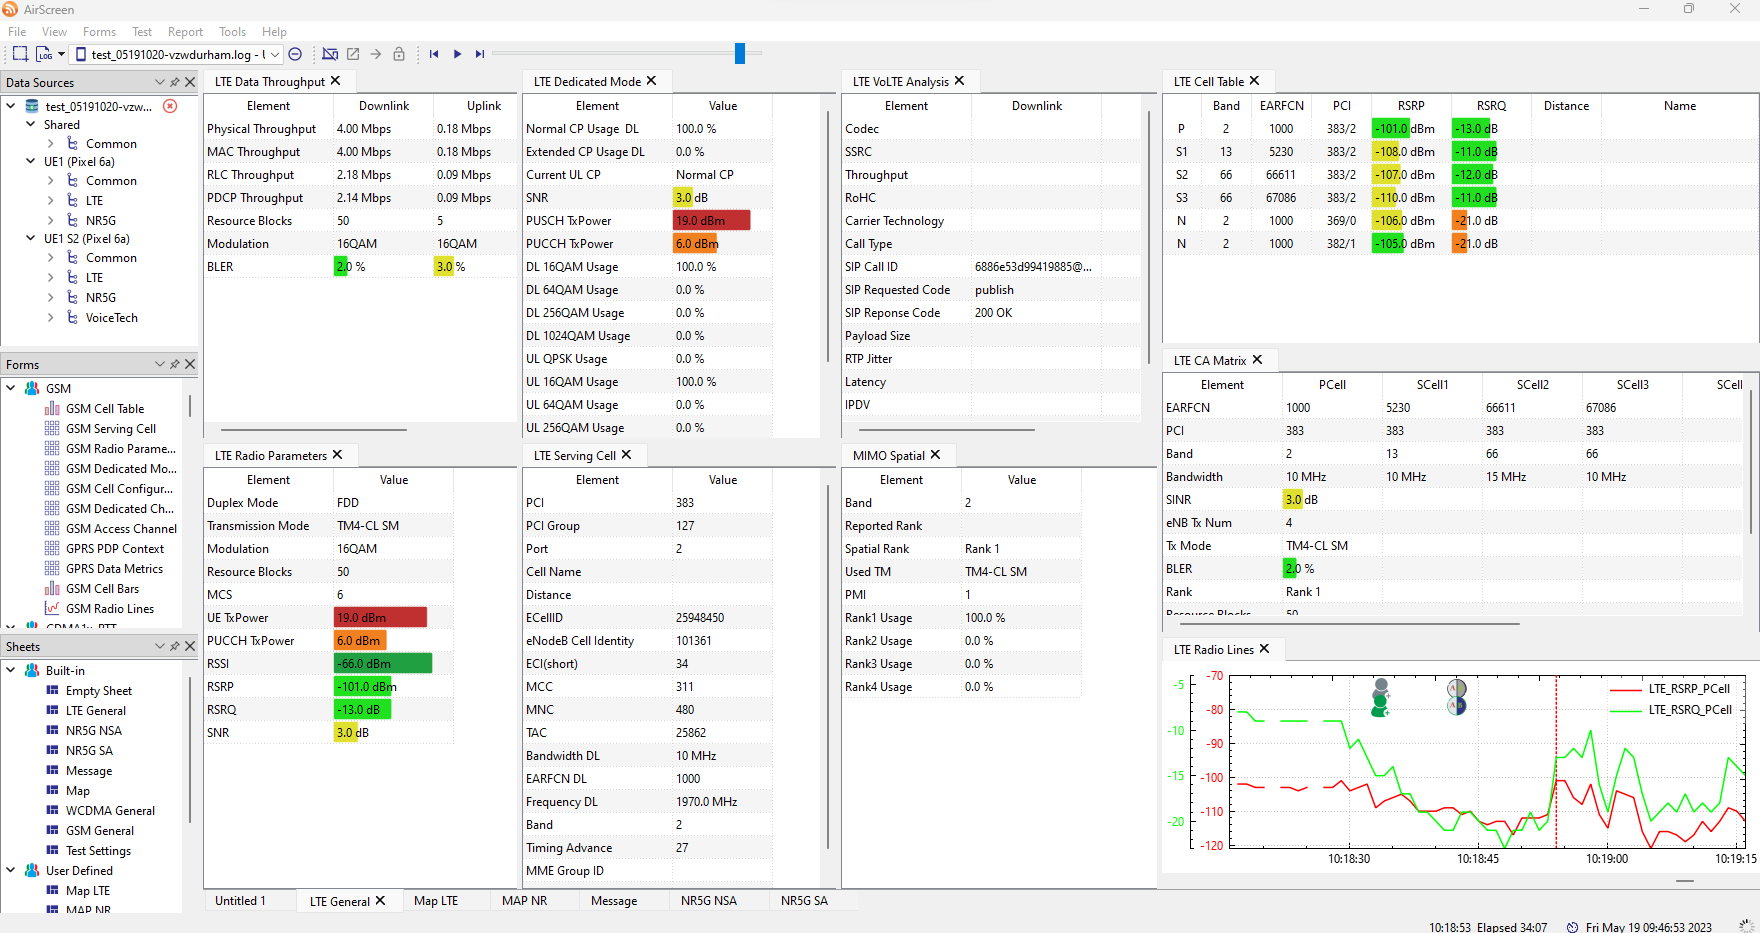
On band 2, LTE there is a 10Mhz carrier. Knowing that 10Mhz carrier has a maximum of 50 resource blocks, I can look at the physical throughput and notice that it is only 4Mbps. Even though the BLER (error-rate) is showing low in this screen, there were many state changes due to poor signal earlier.
Let's look at signaling information around this time as well.
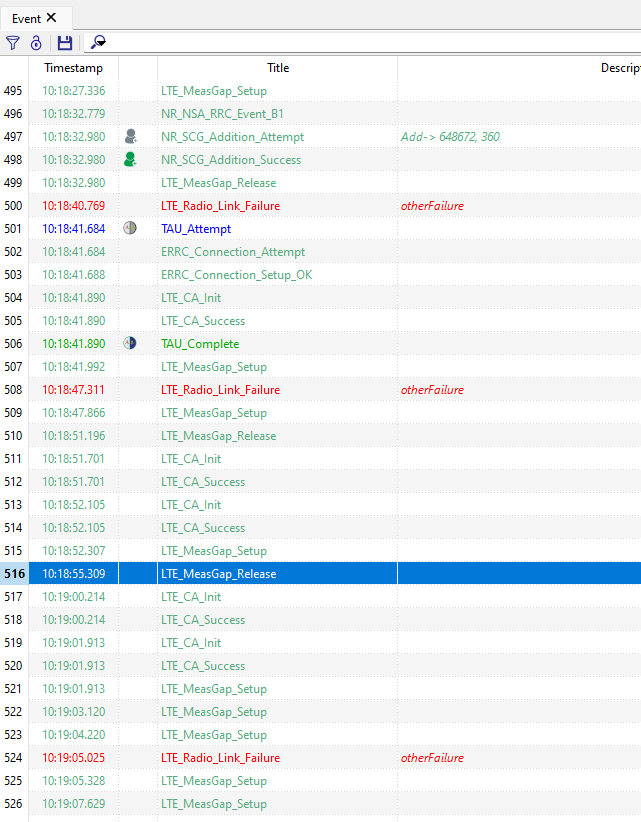
Notice all of the radio link failure messages.
Let's look briefly at the issue that was occurring near the T-Mobile/AT&T tower site.
2023.05.19_09.54.57
In the screenshot below, notice that the throughput is only around 13.79 Mbps. There are a few things that I see hear that could be causing the issue
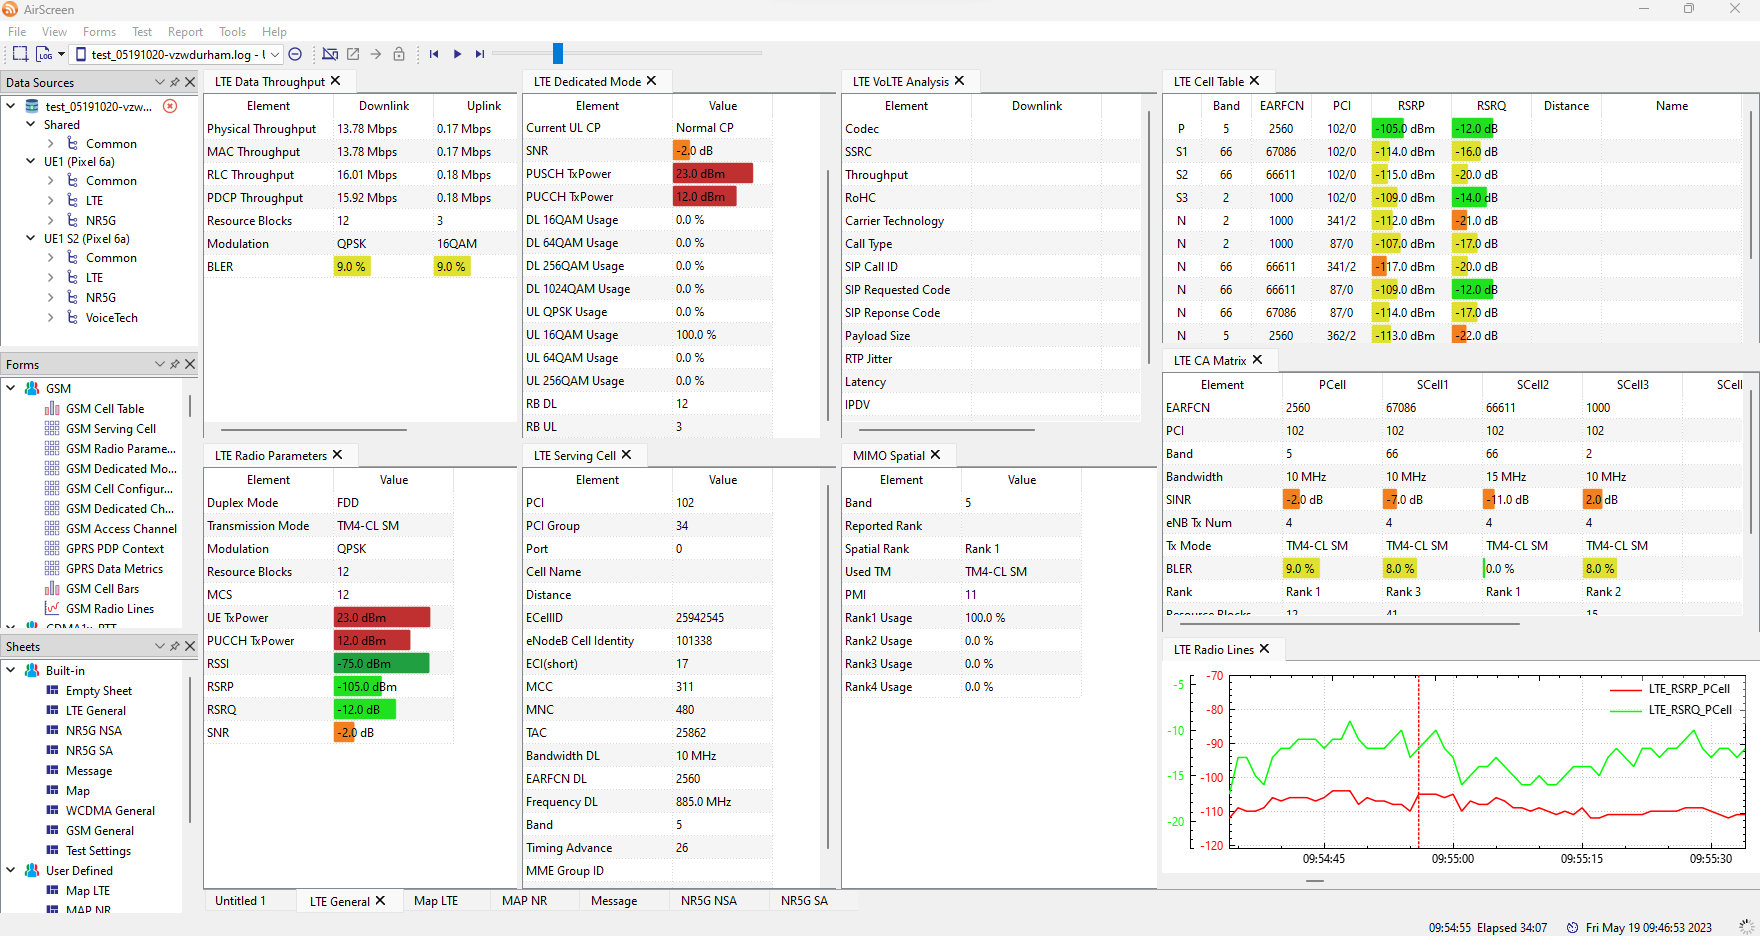
Even though carrier aggregation is occurring, the SINR ratio of each of the cells (primary and secondary cells) does not get any higher than 2db. The other cells have all negative values. This along with poor RSRP/RSRQ values most likely is the issue.
It's quite possible some of these issues are being caused by inter-tower interference.
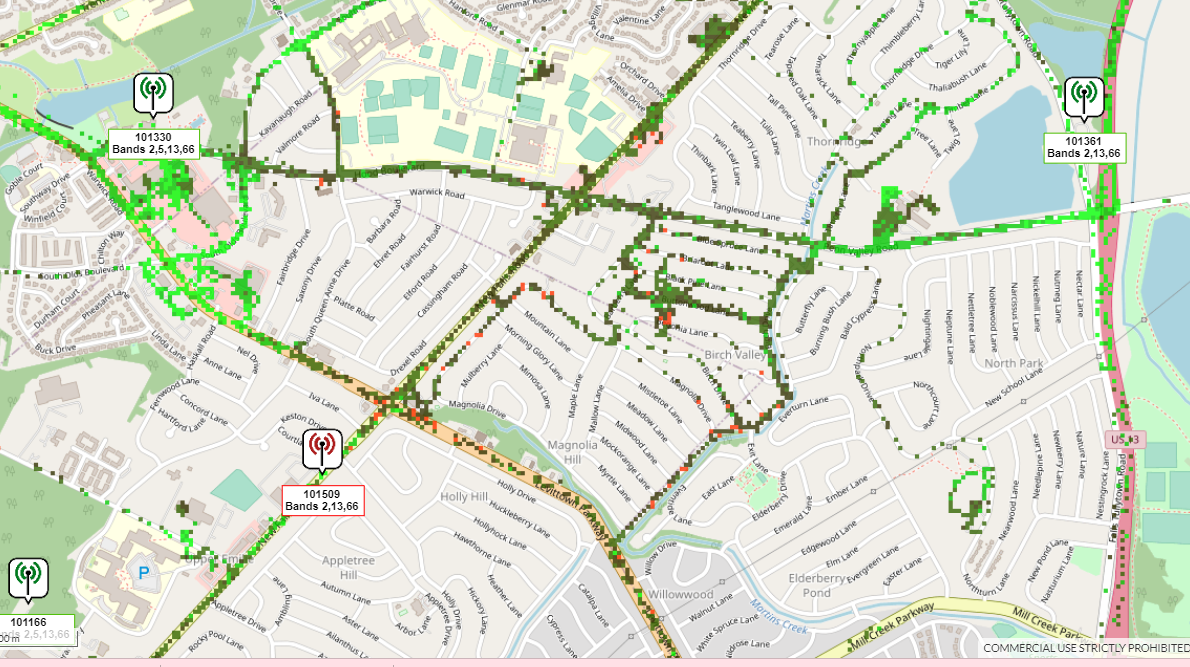
Cellmapper
Let's take a quick-look at Cellmapper to show the Verizon towers near-by. Notice that I am in an area that has some overlapping cell sites. There are no PCI collisions but my phone appears to be handing off kind of often.
Now, let's go back to my Elasticsearch to see how often my signal changed to a different tower. Each shade is a different tower. Here we have purple. green, orange, and grey which each correspond to a different tower.
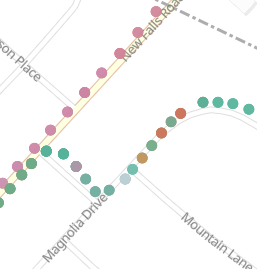
Let's do the same for the other location that was having problems
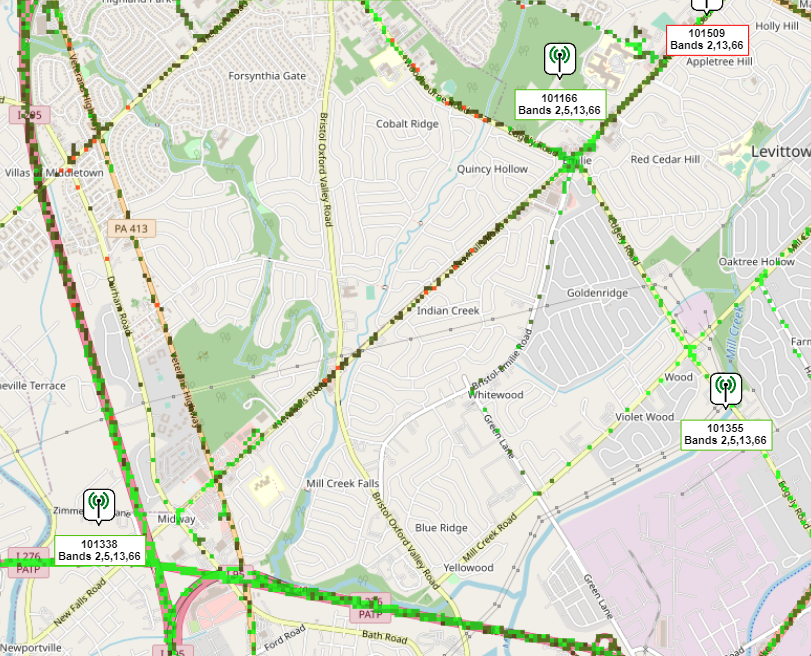
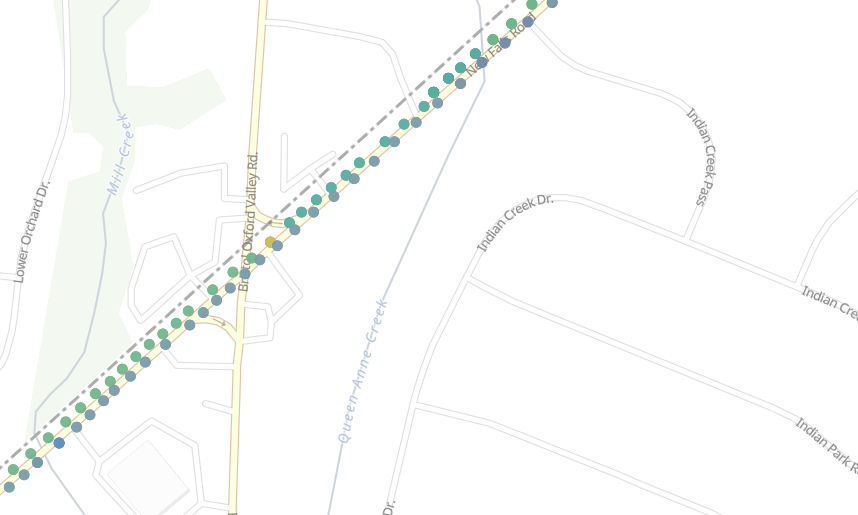
Notice the three different colors here.
Again, not sure if this an issue or not but it's just another tool to use for analysis.